One of the challenges I face is to create a Gravity forms which then the result can be shown as a chart using Chart.js. For this I used the solution below:
1- First created the form using Gravity forms within WordPress. For the update, I will try to implement any form. Then I need to send the result or any field to the result page.
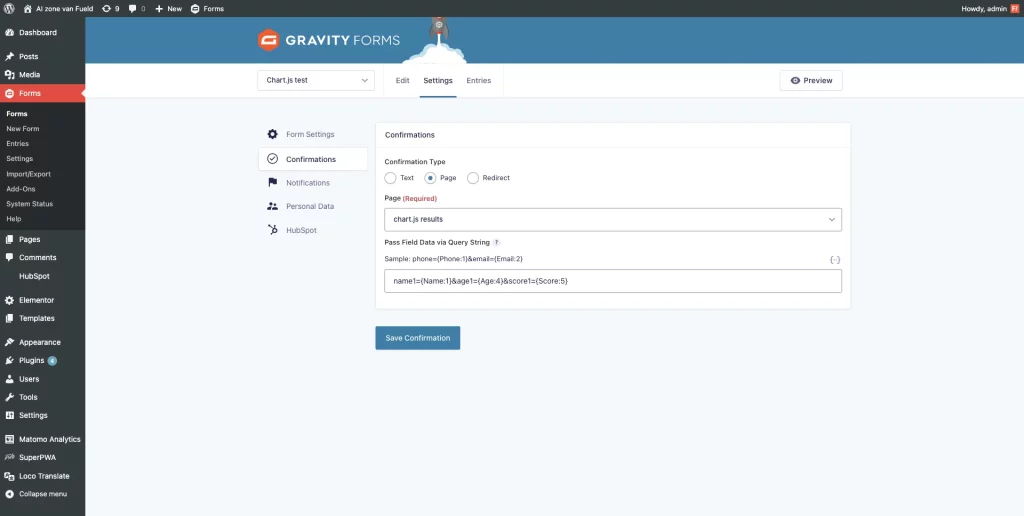
2- For sending the data to the result page, I use the redirect function in Gravity forms and then pass the needed parameters in the URl to the result page.
3- In the result page, I need to read the values from the URL and render the chart using the Chart.js library in HTML. Here is the code
<!DOCTYPE html>
<html>
<head>
  <title>Input Table and Chart Example - Result</title>
  <script src="https://cdn.jsdelivr.net/npm/chart.js"></script>
</head>
<body>
  <h1>Result to be shown in chart</h1>

  <canvas id="chart"></canvas>

  <script>
    // Retrieve the query parameters from the URL
    const urlParams = new URLSearchParams(window.location.search);

    // Get the values from the query parameters
    const name1 = urlParams.get('name1');
    const age1 = parseInt(urlParams.get('age1'));
    const score1 = parseInt(urlParams.get('score1'));

    const name2 = urlParams.get('name2');
    const age2 = parseInt(urlParams.get('age2'));
    const score2 = parseInt(urlParams.get('score2'));

    // Create the chart data
    const chartData = {
      labels: [name1, name2],
      datasets: [
        {
          label: 'Scores',
          data: [score1, score2],
          backgroundColor: ['rgba(255, 99, 132, 0.2)', 'rgba(54, 162, 235, 0.2)'],
          borderColor: ['rgba(255, 99, 132, 1)', 'rgba(54, 162, 235, 1)'],
          borderWidth: 1,
        },
      ],
    };

    // Render the chart
    const ctx = document.getElementById('chart').getContext('2d');
    new Chart(ctx, {
      type: 'bar',
      data: chartData,
      options: {
        responsive: true,
        scales: {
          y: {
            beginAtZero: true,
            max: 200,
          },
        },
      },
    });
  </script>
</body>
</html>